I am currently exploring stock price movements. I hope to publish a full post on my insights soon. Perhaps linking Elliott Waves with the fundamental tug-of-war between buy and sell price action. Here is a neat simulation of traders in an Ising type model. The resulting stock price simulation can be seen in the PDF. The model was created using 1,000,000 traders. If this is really the underlying nature of the movement of stock prices, then by observing a stock trajectory, an observer is really only getting a tiny fraction of the information about the state of the system. If there was a way to implement this model on a wide scale, the results would be really neat.
PDF of the price movement:
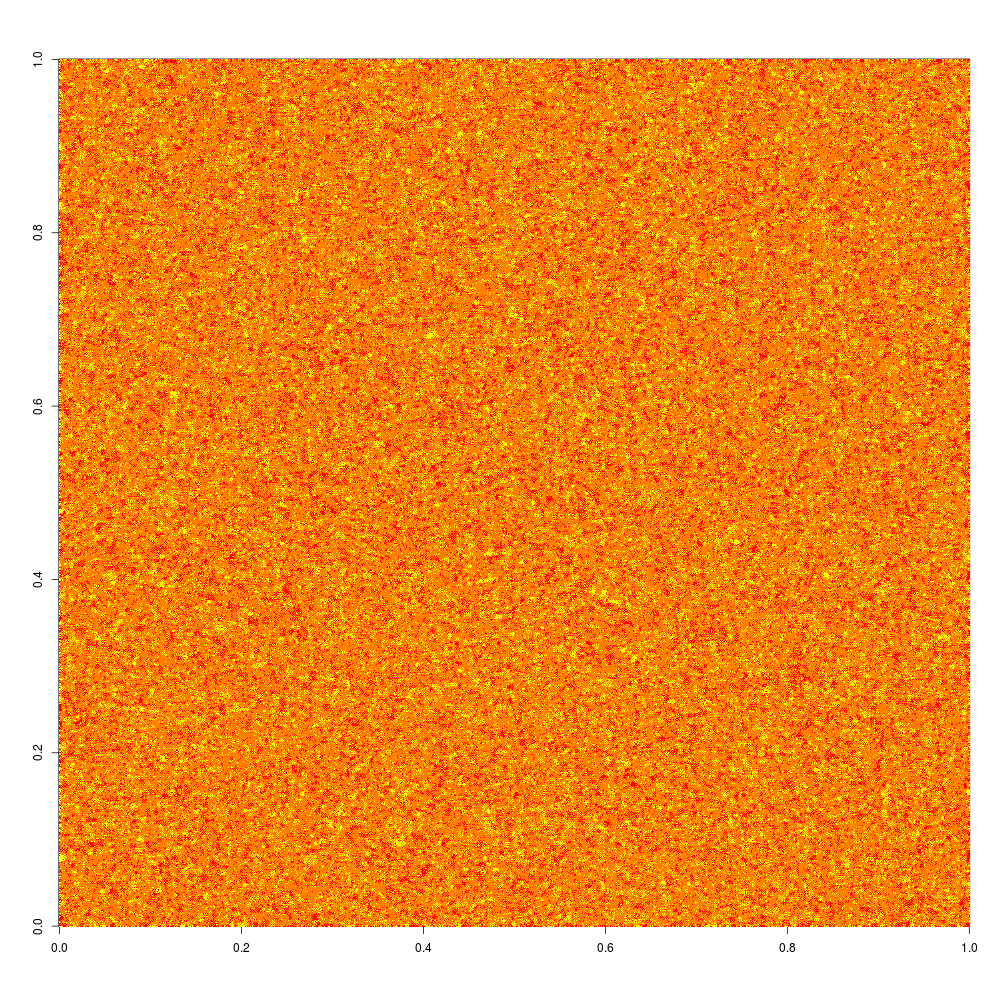
GIF animation of the model:
Red dots are traders short the stock. Yellow dots are traders long the stock. Orange dots are traders neither short nor long the stock.
Red dots are traders short the stock. Yellow dots are traders long the stock. Orange dots are traders neither short nor long the stock.