
Scale, by Geoffrey West, is a thought provoking book about coarse grained quantitative network theories which concern the entire human species and its interaction with the environment. Although verbose — as I think the intended audience is upper high school and entry-level college — it is clear in its depictions and explanations. This book is an important summary of really profound work and research performed at the Santa Fe Institute. And it is a great introduction to understanding power laws and scaling in biology and network topologies.
Category: power law
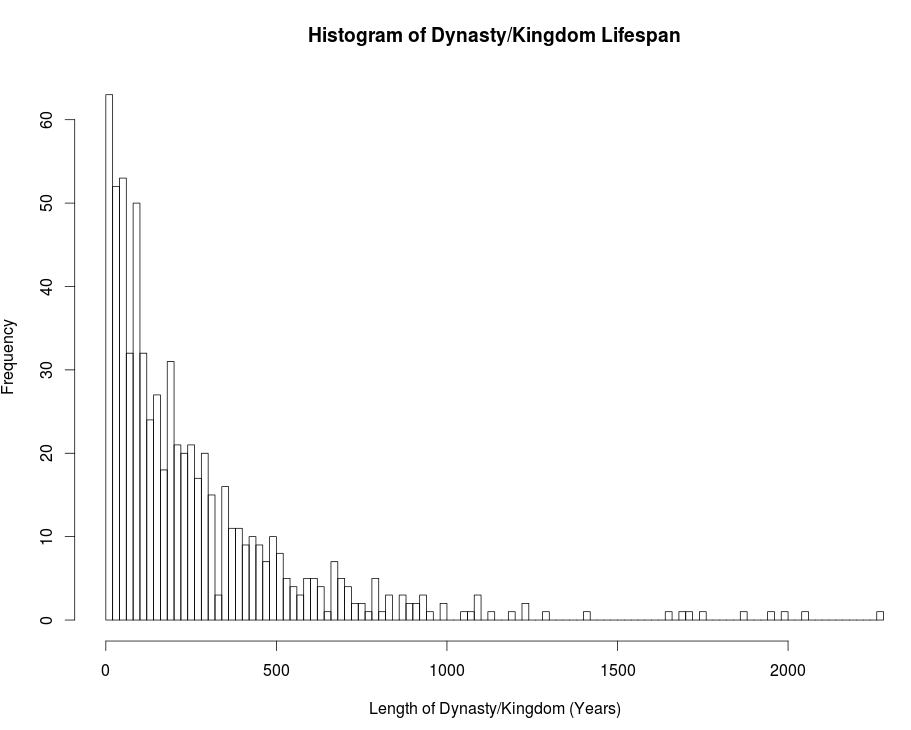
Do there exist studies on the distribution of the lengths of kingdoms and dynasties — distinct political entities — since the 3rd millennium B.C.E.? It seems likely that someone has already studied this topic, but I can not find any papers online. To explain, I have included a file, here, containing the beginning and end dates of about 700 distinct social groups since the dawn of recorded history. It was complied from various Wikipedia pages. I do not doubt that the data is not very reliable, however, graphing the histogram of these lengths, see Figure 1, would provide at least a rough idea of their distribution.
 |
| Figure 1 |
It does seem that a nice distribution curve exists which models the data. The distribution seems to take the shape of a power law at first glance. Doing some work in R, I found that a power law with one set of parameters fits the tail nicely but fails to fit the first half; and vice versa, a power law with a different set of parameters fits the majority but not the tail. My hypothesis is that a power law with alpha equal to 3 may be the best fit. This is a prediction based on the lectures of Geoffrey West, in which he explains that most biological systems exhibit power law distributions with alpha in the 2.5-3.0 range. However, as seen in Figure 2, this does not seem to be the correct range for alpha if a power law is the best fit for this preliminary data.
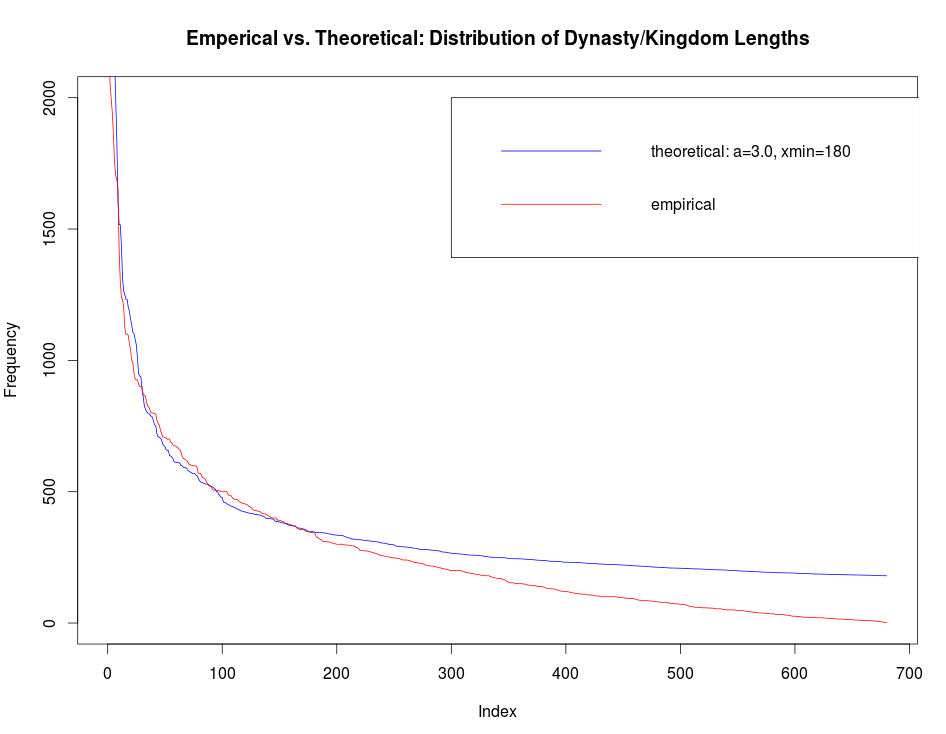 |
| Figure 2 |
The tail of the distribution does not fit well with the parameters shown in Figure 2.
I would venture to guess that the data may not be reliable in the displayed tail region. This would suggest that the data may need improvement in the portion where kingdoms and dynasties exist for longer than 200 years. The data I compiled, may of course be missing many kingdoms and dynasties. I believe that my sample is biased, due to these missing kingdoms and dynasties.
To improve this rough sketch of the distribution of kingdoms and dynasties, a highly systematic method must be devised to correctly measure the length of time of existence for any dynasty and kingdom. Also, this method must consistently be able to distinguish when a kingdom or dynasty begins and ends. The general idea is to measure the length of existence of a distinct political entity in a geographical region.
A sample must be obtained which is not biased. A dataset containing the population of all existing kingdoms and dynasties existing since the 3rd millinium B.C.E. would work best. Even so, this would be biased because it would ignore all the dynasties and kingdoms existing before that time.

